Reggie Yinger
2013 Reliever Usage: Early Results from the Bullpen
Sunday June 9th, 2013
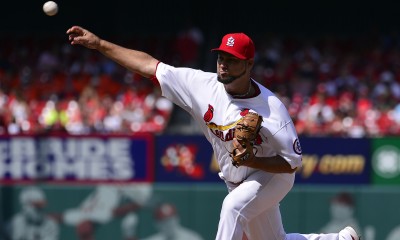
Despite heavy usage, Edward Mujica has been good for St. Louis. (US Presswire)
So how exactly have big-league managers used their relievers during the 2013 season thus far? Here are some interesting trends. Thanks to the nifty Bullpen Usage page located on this site, we're able to see exactly how relievers are deployed, or misused.
Thus far, there have been a total of six different pitchers that have thrown four consecutive days. Two of those six pitchers are full time "closers" - Edward Mujica
and Fernando Rodney. During the span of those four consecutive days of work, Mujica threw a total of 45 pitches, while Rodney threw a total of 51 pitches, respectively. The other relievers are Alfredo Simon (44), Joel Peralta (59), Matt Lindstrom (28), and Wilton Lopez (48).
Here's a look at all relievers in 2013 with at least five saves.
| Rk | Player | SV | Year | Tm | Pit |
|---|---|---|---|---|---|
| 1 | Jason Grilli | 23 | 2013 | PIT | 464 |
| 2 | Mariano Rivera | 21 | 2013 | NYY | 331 |
| 3 | Jim Johnson | 20 | 2013 | BAL | 469 |
| 4 | Joe Nathan | 18 | 2013 | TEX | 367 |
| 5 | Edward Mujica | 18 | 2013 | STL | 353 |
| 6 | Addison Reed | 17 | 2013 | CHW | 432 |
| 7 | Craig Kimbrel | 17 | 2013 | ATL | 363 |
| 8 | Sergio Romo | 16 | 2013 | SFG | 373 |
| 9 | Tom Wilhelmsen | 15 | 2013 | SEA | 406 |
| 10 | Rafael Soriano | 15 | 2013 | WSN | 394 |
| 11 | Aroldis Chapman | 15 | 2013 | CIN | 463 |
| 12 | Grant Balfour | 15 | 2013 | OAK | 457 |
| 13 | Fernando Rodney | 13 | 2013 | TBR | 481 |
| 14 | Ernesto Frieri | 13 | 2013 | LAA | 475 |
| 15 | Brandon League | 13 | 2013 | LAD | 383 |
| 16 | Casey Janssen | 12 | 2013 | TOR | 256 |
| 17 | Glen Perkins | 12 | 2013 | MIN | 355 |
| 18 | Huston Street | 11 | 2013 | SDP | 338 |
| 19 | Jose Veras | 11 | 2013 | HOU | 422 |
| 20 | Heath Bell | 11 | 2013 | ARI | 416 |
| 21 | Rafael Betancourt | 11 | 2013 | COL | 325 |
| 22 | Greg Holland | 11 | 2013 | KCR | 378 |
| 23 | Jonathan Papelbon | 11 | 2013 | PHI | 289 |
| 24 | Bobby Parnell | 9 | 2013 | NYM | 392 |
| 25 | Jim Henderson | 9 | 2013 | MIL | 321 |
| Rk | Player | SV | Year | Tm | Pit |
| 26 | Jose Valverde | 7 | 2013 | DET | 240 |
| 27 | Andrew Bailey | 6 | 2013 | BOS | 286 |
| 28 | Chris Perez | 6 | 2013 | CLE | 316 |
| 29 | Kevin Gregg | 6 | 2013 | CHC | 299 |
| 30 | Steve Cishek | 5 | 2013 | MIA | 429 |
| 31 | J.J. Putz | 5 | 2013 | ARI | 222 |
Of the 31 pitchers listed above, a total of 19 have thrown in game situations three consecutive days at least once during the season. Below are the breakouts for those 19 pitchers including the number of appearances with at least three consecutive days of work and the total number of pitches for all of those appearances.
| Pitcher |
Games | Pitches |
|---|---|---|
| Addison Reed |
1 | 56 |
| Andrew Bailey | 1 | 53 |
| Brandon League | 1 | 57 |
| Craig Kimbrel | 1 | 45 |
| Edward Mujica | 4 | 153 |
| Ernesto Frieri | 2 | 103 |
| Fernando Rodney | 1 | 51 |
| Glen Perkins | 1 | 56 |
| Grant Balfour | 3 | 169 |
| Greg Holland | 1 | 58 |
| Heath Bell | 1 | 36 |
| Huston Street | 1 | 41 |
| Jason Grilli | 1 | 42 |
| Jim Johnson | 1 | 51 |
| Joe Nathan | 2 | 75 |
| Jose Valverde | 1 | 47 |
| Jose Veras | 1 | 44 |
| Rafael Soriano | 1 | 57 |
| Sergio Romo | 2 | 61 |
In total, there have been 87 different pitchers who have thrown three consecutive days this season. Amon the 87 different, who are not considered "closers", these are the top five relievers (same criteria as the above table).
| Pitcher | Games | Pitches |
|---|---|---|
| Cory Gearrin | 3 | 127 |
| Jesse Crain | 2 | 90 |
| Joel Peralta | 2 | 115 |
| Ronald Belisario | 3 | 104 |
| Scott Rice | 3 | 121 |
In addition to seeing how pitchers are being used this season, we can also examine at what point pitchers are being used during the course of a game. Fans can access a leverage index to identify when a pitcher is being used, whether it be in high-leverage or low-leverage situation. Fangraphs.com keeps track of different leverage iterations, but for relievers, I'm primarily interested in gmLI which is a pitcher's average leverage index when he enters a game. To summarize the context of leverage, a neutral leverage is 1, a high leverage is anything greater than 1.5, and low leverage is anything less than 1. 10% of all real game situations have a leverage index greater than 2, while 60% have a leverage of less than 1.
Here are the qualified top relievers as it relates to gmLI this season. You can see the full list of gmLI leaders for the 2013 by clicking here.
| Pitcher | gmLI |
|---|---|
| Santiago Casilla | 2.33 |
| Edward Mujica | 2.06 |
| Bobby Parnell | 2.05 |
| Mariano Rivera | 1.94 |
| Casey Janssen | 1.94 |
| Jesse Crain | 1.94 |
| Jim Johnson | 1.93 |
Amazingly, Santiago Casilla of the San Francisco Giants is still tops among all qualified relievers this season despite not appearing in a game since May 20. He's currently recovering from a procedure on his right knee.
Just by looking at all the data collected, we can see that Edward Mujica has pitched a lot for the Cardinals this season, but has also been optimized correctly. Despite appearing in 27 games this season and throwing over 350 pitches, we must remember that Mujica is essentially a one-pitch reliever (split-finger fastball / super change-up).
For fantasy purposes, you can use gmLI to potentially determine how a manager will use a reliever, possibly predicting "cheap save" opportunities, or to determine who the next "closer" might be if the opportunity becomes available. Also, if you're generally looking for a reliever who can help your overall pitching categories, a high gmLI usually indicates that a reliever has likely earned the "trust" of the manager in close games because of his good numbers.
Here are a few relievers that have recorded less than five saves with good gmLI numbers. I wouldn't hesitate to add these relievers for potential cheap saves (when the regular closer has a day off) or simply because they are good in late innings and see a lot of usage.
| Pitcher | gmLI | Games | K/9 | BB/9 | % Owned |
|---|---|---|---|---|---|
| Jesse Crain
| 1.94 | 30 | 12.0 | 2.9 | 15% |
| James Russell
| 1.64 | 30 | 8.3 | 2.6 | 5% |
| Joel Peralta | 1.55 | 32 | 9.5 | 3.8 | 20% |
| Robbie Ross
| 1.62 | 27 | 7.7 | 2.7 | 4% |
| Jared Burton
| 1.60 | 28 | 9.2 | 3.2 | 8% |
| Koji Uehara
| 1.54 | 25 | 12.9 | 1.5 | 14% |
| Sean Doolittle
| 1.38 | 27 | 8.8 | 1.3 | 14% |
All statistics as of June 7 2013