Reggie Yinger
What's the Deal With Justin Upton?
Saturday September 15th, 2012
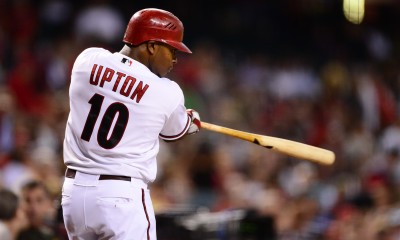
What's up with Justin Upton in 2012?. (US Presswire)
However, the right fielder has struggled just to post league average numbers this season. Mixed into the low offensive numbers, Upton's name was also thrown out as a trade candidate during the trade deadline in July, and while this may have been an internal issue, his offensive statistics didn't help his cause for staying in Arizona.
After finishing fourth in NL MVP voting a season ago, the 24-year-old slugger appeared to be emerging as an elite player and fully capable of hitting 30 home runs and stealing 20 bases. After posting a triple-slash line of .289/.369/.529 with a .385 wOBA in 159 games last season, Upton has fallen well below those expectations this year, and is hitting just .271/.349/.405 with 13 home runs (a career low in HR as of right now).
I can speculate about an injury to Upton (left shoulder in 2010) but without that information readily available, I have to assume for the most part that he is healthy. We do know that Upton missed games earlier this season with a thumb injury, and that thumb could still be a lingering issue. In addition to his thumb, Upton could also still be dealing with a shoulder ailment that didn't heal properly after 2010. Since this is all speculation at this point, let's assume he's 100% healthy.
Next up, now that the injury talk is out of the way, let's take a look at Upton's batted ball data over the past three seasons. Below is a chart containing ground ball percentage (GB%), line drive percentage (GB%), fly ball percentage (FB%), and home runs to total fly balls hit (HR/FB%). This data is from 2010 to 2012 thanks to FanGraphs.com.
After taking a quick glance at the data, two things jump right out at us - Upton's ground ball (GB%) percentage is at a three year high along with his fly ball (FB%) percentage being at a three year low. A typical power hitter will hit a higher percentage of fly balls, while a player that hits a lot of ground balls will likely have a higher batting average along with a high batting average on balls in play (BABIP). For a player like Upton (especially playing home games at Chase Field) - we would like to see those numbers more in line with his 2011 totals. However, his 2012 totals thus far, remind us of his 2010 numbers, a season where Upton hit .273/.356/.442 with 17 home runs.
To break it down even further and give a better visual of the changes, take a look at the second chart (above) that shows the increases and decrease of the same data for the same time period. When looking at the numbers for 2010, these are increases/decreases from the 2009 season. Overall, Upton has seen a large increase in ground balls and line drives with a major decrease in fly-balls and obviously home runs to fly balls hit.
Next up, I wanted to review where Upton was hitting the baseball on the field. We have the data that shows what type of batted balls he was hitting, but let's see where he was going in regards to balls hit to left, center, and right. Because I'm interested in Upton's power numbers and decrease in fly balls hit, the below images show percentage of fly balls hit and where they were hit over the past three seasons.
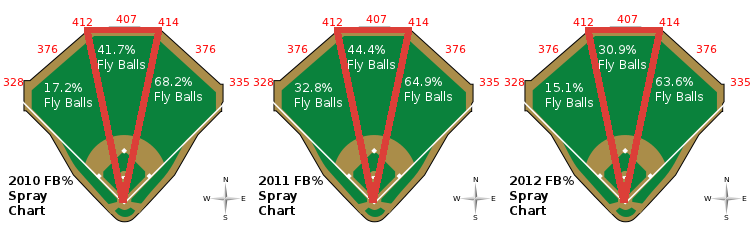
One thing that remains consistent for the past three seasons is Upton's fly ball numbers to right field. However, from 2011 to 2012, there is a dramatic decrease in fly balls hit to left field or pulled fly balls. Based on FB% in 2011 and home run totals, Upton's big power numbers come from hitting fly balls to left field, as 22 of his 31 homers last season came from pulling the ball to left field. Although he's consistently hit fly balls to right field, only three home runs have come from hitting balls to right field this season. His fly ball numbers to left field are low, but his ground ball numbers to left field currently sit at 72% - making it possible that his approach is different at the plate this year or he truly is battling some type of injury.
After examining Upton's batted ball data, we should also look at his approach and swing tendencies at the plate. For this next part, let's examine just the 2011 and 2012 seasons via Brooks Baseball and the Baseball Prospectus Pitchf/x Hitter Profiles. There is plenty of great data to review, so I'll review some of the highlights I found.
First off, I noticed that according to FanGraphs, Upton created 4.30 wCB/C in 2011. The wCB/C stands for the average number of runs created against 100 curveballs thrown to Upton. His 4.30 wCB/C number last season was second highest overall in the majors last season. In 2012, Upton's wCB/C number is -1.44. So, is he swinging at less curveballs or having bad results with the pitch?
The above graph from 2011 shows that Upton did a good job of swinging at breaking pitches that were in the middle of the plate from both left and right-handed pitchers (from top of the strike zone to the bottom) as well as swinging on breaking balls on the inside of the plate.
The next image shows the same swing percentage on breaking ball pitches from LHP & RHP, but the time frame is for 2012.
As you can see, Upton has rarely swung at breaking balls within the strike zone (with the exception of the bottom). The high percentage of swinging strikes on those pitches outside of the zone could play a major culprit of why Upton is hitting so many ground balls this season.
Next up, let's examine Upton's swing percentage on all pitches from just left-handed pitchers. The first is a chart of Upton's swings against lefties from 2011.
Everything looks good here as far as Upton swinging. He's swinging at pitches from middle-to-in of the strike zone versus lefties. The next image below shows the same swing percentage against lefties, but for the 2012 season.
The big change we can see from 2011 to 2012 with lefties is the fact that in 2012, Upton's percentage of swings versus lefties on pitches near the middle of the plate is down approximately 7-to-10 percent. He also has increases on swings on the outside of the strike zone, especially on high and low pitches from lefties in 2012. His swing percentage on pitches up in the zone (middle-to-inner) from 2011 to 2012 is also about 8-to-9 percent lower this season.
The next two images are that of Upton's swing percentage against both lefties and right-handers where the pitch type is off-speed.
As you can see from the color of red, Upton swung at almost every type of off-speed offering in 2011 from both righties and lefties, and made them pay for throwing off-speed pitches. His slugging percentage on these types of pitches (where he swung) was over 1.000 in most cases. The next image below shows the same type of data (RHP & LHP vs. Off-speed) but for 2012.
For the most part, Upton does a good job at swinging at the off-speed pitches in 2012, but the main theme that seems to be lacking is the number of pitches that pitchers are throwing to Upton that are off-speed. However, if they are throwing off-speed pitches to him, they are making it a point to keep them low in the strike zone or just off the plate.
My final two images simply compare the pitch frequency for all pitches to Upton by left and right-handed pitchers. Below is the frequency and location of all pitches to Justin in 2011.
The above image highlights that Upton is seeing a high dosage of pitches from the middle to the outer area of the strike zone and a good chunk of pitches in the same area but at the bottom of strike zone. The next and final image shows pitch frequency for all pitches to Upton by left and right-handed pitchers, but for 2012.
While the percentages in 2012 are not significantly less than the percentages in 2011, there appears to be a serious emphasis on pitchers keeping their pitches not only out of the middle of the strike zone, but also keeping pitches completely out of the strike zone while pitching to Upton.
In closing, based on the previous two charts on frequency of pitches, there doesn't seem to be a dramatic decrease of where pitchers are throwing Upton. Although he could be battling a thumb or shoulder injury this season which would hinder his ability to put the ball in the air, based on his swing percentage on off-speed and breaking balls from 2011 to 2012, it could be a case of Upton's pitch recognition and plate discipline. However, don't make the mistake of viewing Upton as just an average baseball player based on a down 2012 season. IF he can make the necessary adjustments at the plate and fix whatever injury ailments he may have, his 2011 numbers are definitely repeatable.
RELATED ARTICLES